Tableau vs Power BI vs Looker
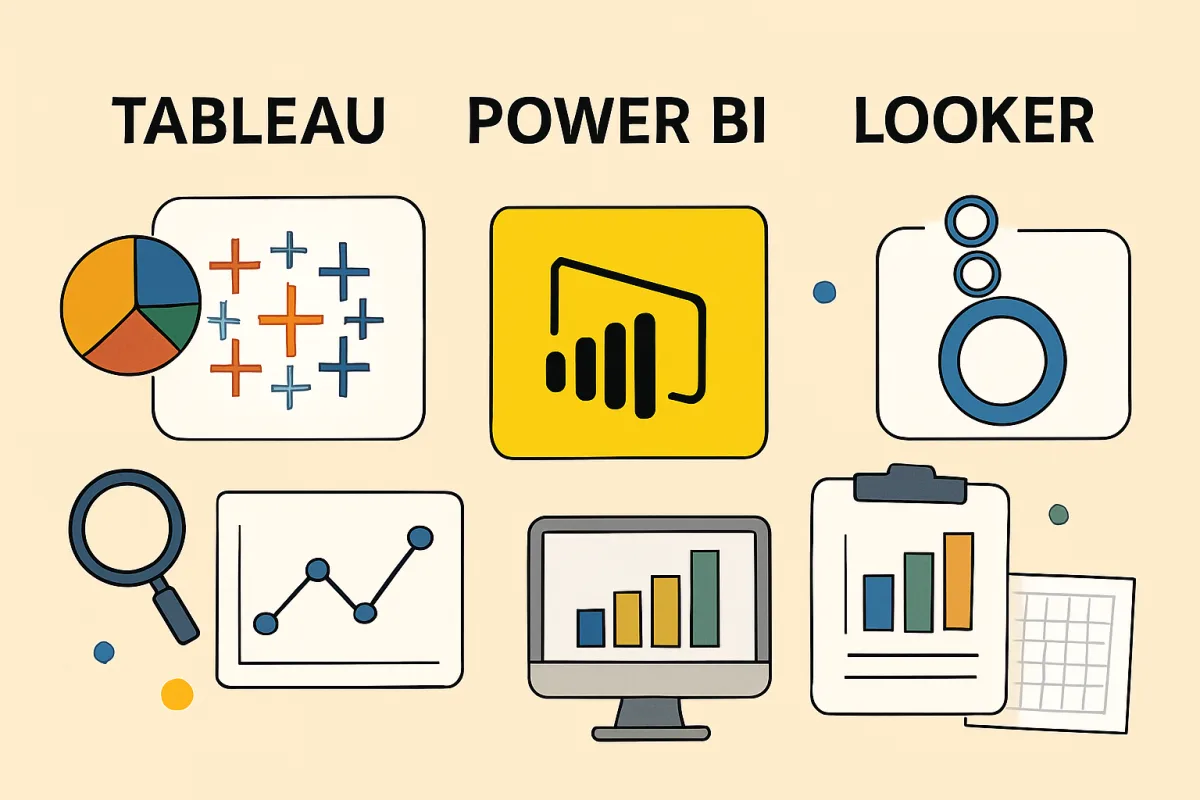
Tableau, Power BI, and Looker are leading business intelligence tools, each with unique strengths. Tableau excels in data visualization capabilities, making it ideal for users who prioritize graphical representations. Power BI offers seamless integration with Microsoft products, making it a great choice for organizations already using the Microsoft ecosystem. Looker stands out with its data modeling capabilities and is best suited for companies that require robust data governance and analytics. Choosing the right tool depends on your specific needs, including budget, existing software, and user expertise.
Quick Summary
Tableau, Power BI, and Looker are top business intelligence tools, each catering to different needs. Tableau is best for visualization, Power BI for Microsoft integration, and Looker for data modeling. Your choice should align with your organization's specific requirements and existing tools.
Curator Notes
Tableau is renowned for its powerful data visualization capabilities, allowing users to create interactive and shareable dashboards. It is particularly favored by data analysts and business intelligence professionals who require advanced visual analytics. Tableau's flexibility and extensive customization options make it suitable for organizations with complex data visualization needs, although it can be more expensive than its competitors.
Power BI, on the other hand, is tightly integrated with Microsoft products, making it an attractive option for businesses already using tools like Excel and Azure. Its user-friendly interface and affordability make it accessible for small to medium-sized businesses. However, while it offers solid visualization features, some users find it less flexible than Tableau.
Looker is designed for organizations that prioritize data governance and modeling. Its LookML language allows for sophisticated data modeling, making it ideal for companies that need to maintain strict data standards. Looker is best for larger enterprises that require a robust analytics solution, although it may have a steeper learning curve for new users.
Each tool has its trade-offs, and the best choice depends on your organization's specific needs and existing infrastructure.
Recommended Options
- Tableau: Best for Data visualization and analytics professionals Offers advanced visualization capabilities and customization options. Signal checked: Widely used in large enterprises and praised for its visual analytics. Alternative to consider: Power BI for better Microsoft integration.
- Power BI: Best for Organizations using Microsoft products Seamless integration with Microsoft tools and cost-effective. Signal checked: Popular among small to medium-sized businesses for its affordability. Alternative to consider: Tableau for more advanced visualization.
- Looker: Best for Companies needing robust data governance Signal checked: Preferred by larger enterprises for its analytics features. Alternative to consider: Tableau for superior visualization.
Best Sources
Videos and Community Signals
Looker vs Power BI vs Tableau (2026) - Which One Is BEST? Choosing the right data analytics and business intelligence (BI) tool ...
An industry data expert breaks down Power BI vs Tableau, explaining how each tool works in real companies and why many ...
Comparison
| Decision Point | Good Starting Choice | When to Go Further |
|---|---|---|
| Data Visualization | Power BI for basic needs and ease of use. | Tableau for advanced visual analytics. |
| Integration with Existing Tools | Power BI for Microsoft ecosystem users. | Looker for complex data modeling needs. |
| Cost | Power BI for budget-conscious organizations. | Tableau for organizations that can invest in advanced features. |
FAQ
Power BI is often the best choice for small businesses due to its affordability and ease of use.
Yes, Tableau is capable of handling large datasets, but performance may depend on the data source and complexity of the visualizations.
Yes, Looker supports real-time analytics, making it suitable for organizations needing up-to-date insights.