Candlestick Chart Reading Tips
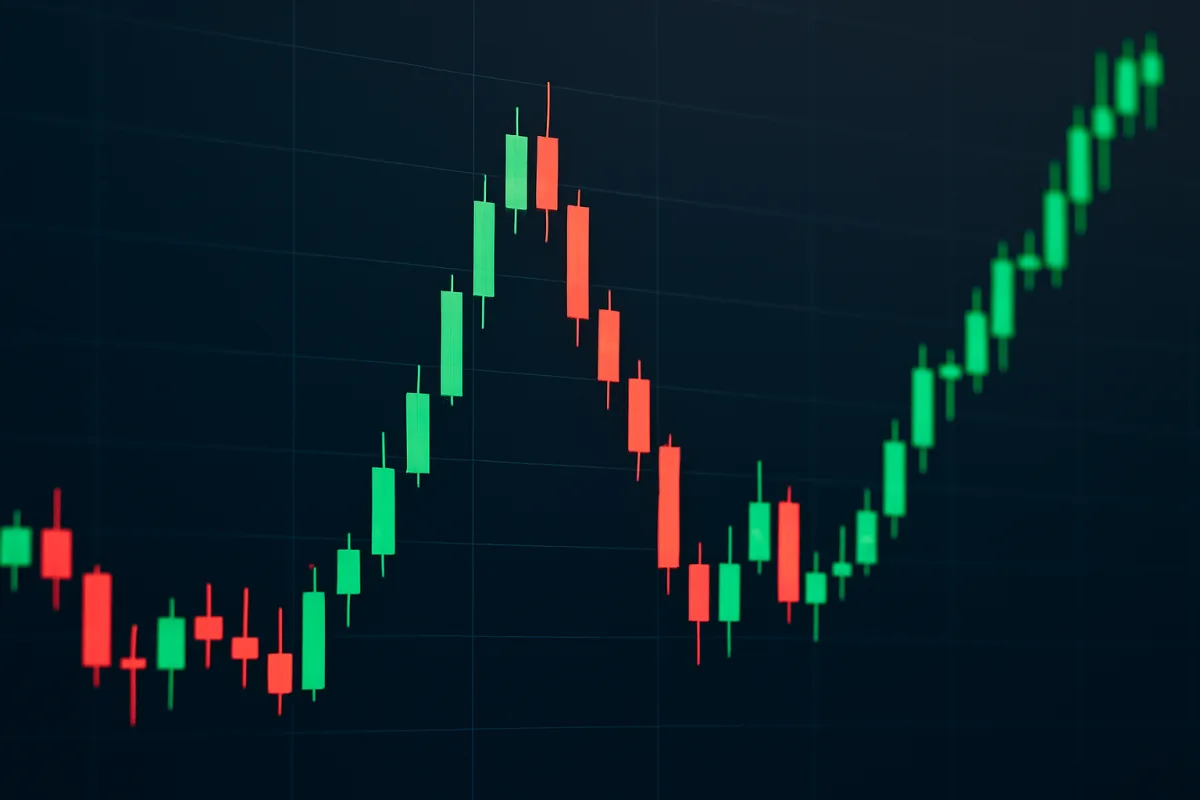
Understanding candlestick charts is essential for analyzing market trends in crypto and other financial markets. Each candlestick represents price movement over a specific period, showing open, high, low, and close prices. Key patterns, such as doji, hammer, and engulfing patterns, can indicate potential market reversals or continuations. Familiarizing yourself with these patterns can enhance your trading strategy and decision-making process. Additionally, combining candlestick analysis with other indicators, such as volume and moving averages, can provide a more comprehensive view of market dynamics.
Quick Summary
Candlestick charts are vital tools for traders, especially in the volatile crypto market. Each candlestick reveals crucial price information, helping traders identify trends and potential reversals. Key patterns like doji and engulfing provide insights into market sentiment. By mastering these patterns and integrating them with other indicators, traders can make more informed decisions. This guide offers practical tips for reading and interpreting candlestick charts effectively.
Curator Notes
Candlestick charts are a fundamental aspect of technical analysis in trading, particularly in the crypto space. Each candlestick provides a visual representation of price movements over a specific time frame, encapsulating the open, high, low, and close prices. Understanding how to read these charts can significantly enhance a trader's ability to predict market movements and make informed decisions.
Key patterns in candlestick charts, such as doji, hammer, and engulfing patterns, are crucial for identifying potential market reversals. A doji, for instance, indicates indecision in the market, while a hammer suggests a potential bullish reversal after a downtrend. Recognizing these patterns can help traders anticipate price movements and adjust their strategies accordingly.
It's essential to consider the context in which these patterns appear. For example, a hammer pattern following a significant downtrend may signal a bullish reversal, but if it appears in an uptrend, it could indicate a temporary pause rather than a reversal. Therefore, analyzing the broader market context is vital for accurate interpretation.
Combining candlestick analysis with other indicators can further enhance trading strategies. For instance, using volume indicators alongside candlestick patterns can provide insights into the strength of a price movement. A price increase accompanied by high volume is generally more reliable than one with low volume.
Traders should also be aware of the psychological aspects behind candlestick patterns. Market sentiment plays a significant role in price movements, and understanding the emotions driving traders can provide additional context for interpreting candlestick patterns. Lastly, practice is key to mastering candlestick chart reading.
Regularly analyzing charts and patterns can help traders develop a keen eye for recognizing trends and making quick decisions. Utilizing demo accounts or paper trading can be an effective way to practice without financial risk. In summary, mastering candlestick chart reading involves understanding key patterns, considering market context, integrating other indicators, and practicing regularly.
By honing these skills, traders can improve their market analysis and decision-making abilities.
Best Sources
Videos and Community Signals
Ready to unlock the secret behind real Bitcoin trading profits? In this short clip, I reveal a powerful, time-tested strategy to ride ...
Please subscribe to my official channel! ➜ @CryptoCasey *Tangem Card ▻ https://bit.ly/Tangem-x1* ⭕ *Tangem Ring ...
Comparison
| Decision Point | Good Starting Choice | When to Go Further |
|---|---|---|
| Online booking | A simple booking page with service duration, staff assignment and confirmation emails. | Multi-location calendars, deposits, cancellation rules and waitlist handling. |
| Client records | Basic notes, visit history and contact details are enough to start. | Segmentation, purchase history, memberships, forms and before-after notes become more important. |
| Reminders | SMS or email reminders help reduce no-shows without adding admin work. | Automated rebooking, follow-up campaigns and missed-appointment recovery matter more. |
| Payments | Card capture and checkout should be simple and transparent. | Packages, memberships, staff commissions, tips and refunds need cleaner reporting. |
| Marketing | Light email or SMS campaigns are useful if they are easy to run. | Automated win-back, birthday offers, review requests and audience segments create more leverage. |
FAQ
A candlestick chart is a type of financial chart that displays the price movements of an asset over time, showing the open, high, low, and close prices for each time period.
Typically, a green or white candlestick indicates that the closing price is higher than the opening price (bullish), while a red or black candlestick indicates that the closing price is lower than the opening price (bearish).
Traders use candlestick patterns to identify potential market reversals or continuations. Recognizing patterns like doji, hammer, and engulfing can help traders make informed decisions about entry and exit points.